


Page 18 - CIJ Sept 2025- Digital Edition
P. 18
COVER STORY


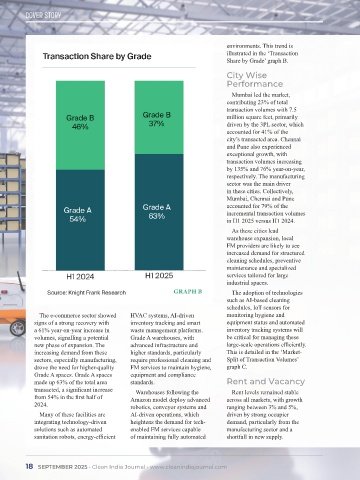
                                                                            environments. This trend is
                                                                            illustrated in the ‘Transaction
                                                                            Share by Grade’ graph B.
                                                                            City Wise
                                                                            Performance

                                                                              Mumbai led the market,
                                                                            contributing 23% of total
                                                                            transaction volumes with 7.5
                                                                            million square feet, primarily
                                                                            driven by the 3PL sector, which
                                                                            accounted for 41% of the
                                                                            city’s transacted area. Chennai
                                                                            and Pune also experienced
                                                                            exceptional growth, with
                                                                            transaction volumes increasing
                                                                            by 135% and 76% year-on-year,
                                                                            respectively. The manufacturing
                                                                            sector was the main driver
                                                                            in these cities. Collectively,
                                                                            Mumbai, Chennai and Pune
                                                                            accounted for 79% of the
                                                                            incremental transaction volumes
                                                                            in H1 2025 versus H1 2024.
                                                                              As these cities lead
                                                                            warehouse expansion, local
                                                                            FM providers are likely to see
                                                                            increased demand for structured
                                                                            cleaning schedules, preventive
                                                                            maintenance and specialized
                                                                            services tailored for large
                                                                            industrial spaces.
                                                          GRAPH B             The adoption of technologies
                                                                            such as AI-based cleaning
                                                                            schedules, IoT sensors for
              The e-commerce sector showed   HVAC systems, AI-driven        monitoring hygiene and
            signs of a strong recovery with   inventory tracking and smart   equipment status and automated
            a 61% year-on-year increase in   waste management platforms.    inventory tracking systems will
            volumes, signalling a potential   Grade A warehouses, with      be critical for managing these
            new phase of expansion. The     advanced infrastructure and     large-scale operations efficiently.
            increasing demand from these    higher standards, particularly   This is detailed in the ‘Market-
            sectors, especially manufacturing,   require professional cleaning and   Split of Transaction Volumes’
            drove the need for higher-quality   FM services to maintain hygiene,   graph C.
            Grade A spaces. Grade A spaces   equipment and compliance
            made up 63% of the total area   standards.                      Rent and Vacancy
            transacted, a significant increase   Warehouses following the     Rent levels remained stable
            from 54% in the first half of   Amazon model deploy advanced    across all markets, with growth
            2024.                           robotics, conveyor systems and   ranging between 3% and 5%,

              Many of these facilities are   AI-driven operations, which    driven by strong occupier
            integrating technology-driven   heightens the demand for tech-  demand, particularly from the
            solutions such as automated     enabled FM services capable     manufacturing sector and a
            sanitation robots, energy-efficient   of maintaining fully automated   shortfall in new supply.


          18  SEPTEMBER 2025 • Clean India Journal • www.cleanindiajournal.com

